What's My Home Worth?
Get a free, AI-powered home valuation report based on current Philadelphia market trends and recently sold properties.
Free Report
No Obligation
Real-time Data
Venture Philly Group | Philadelphia Realtors

(215) 592-9522
Get a free, AI-powered home valuation report based on current Philadelphia market trends and recently sold properties.
PHILADELPHIA REAL ESTATE
Your home’s value depends on hyper-local factors that national tools often miss.

ALGORITHM ESTIMATE

DATA-DRIVEN ONLY

Local EXPERT STRATEGY
Algorithms estimate. We strategize.
PHILADELPHIA REAL ESTATE
Center City Market Snapshot
Comprehensive residential sales data covering active listings, pending contracts, and closed transactions across Center City Philadelphia over the last 28 months. Your specific home’s value depends on many factors such as finishes, layout, floor level, parking, outdoor space, and price comparable sales near you.
MARKET DATA
Explore the Numbers
Based on 3,310 closed transactions · Last 12 months
Ratio above 100% = sold above list. Below 100% = sold below list. Jan 2020 – Jul 2026.
* Jul 2026 is partial — data through July 15. Apr 2022 reached 100% L2S — sellers received full asking price on average.
Based on 24,873 closed sales · Jan 2020 – Jul 2026 · 6 full years of data.
6 years of data smooths out year-to-year variance for a reliable seasonal signal.
| Month | Median Price | Median DOM | L2S Ratio | Avg Closed Sales |
|---|
Absorption rate = active listings ÷ avg. monthly closed sales. Based on last 6 full months of data (Jan–Jun 2026).
| Neighborhood | Median Price | Median DOM | L2S Ratio | Avg Negotiate | Sales | Price Trend |
|---|
Neighborhoods with fewer than 50 closed sales excluded. Data: Jan 2020 – Jul 2026.
$/sqft normalizes for home size. Based on 24,873 closed sales.
| Neighborhood | Garage Sales | % With Garage | Median W/ Garage | Median W/O Garage | $/sqft Premium | Availability |
|---|
Neighborhoods with 50+ closed sales. Sorted by number of garage sales. Jan 2020 – Jul 2026.
Based on 633 new construction and 7,206 existing home sales. Jan 2020 – Jul 2026.
| Neighborhood | New Sales | % of Market | New Median | Existing Median | Premium |
|---|
Neighborhoods with 50+ closed sales. Sorted by new construction sales volume. Jan 2020 – Jul 2026.
Based on 24,873 closed sales. Jan 2020 – Jul 2026.
| Neighborhood | Cash Sales | % Cash | Cash Median | Financed Median | Cash L2S | Financed L2S |
|---|
Neighborhoods with 50+ closed sales, sorted by cash sale rate. Jan 2020 – Jul 2026.
2026 is partial year (Jan – Jul 15). Based on 24,873 closed sales.
2021 was peak year — 5,131 closings. 2026 partial year pace projects ~2,800.
| Year | Median Price | DOM | L2S | $/sqft | Sales |
|---|---|---|---|---|---|
| 2020 | $415,000 | 29d | 97.1% | $299 | 3,955 |
| 2021 | $435,000 | 24d | 97.6% | $315 | 5,131 Peak Vol |
| 2022 | $446,450 | 23d | 97.9% | $327 | 4,234 Peak Price |
| 2023 | $426,500 | 27d | 97.1% | $324 | 3,317 Correction |
| 2024 | $450,000 | 28d | 97.0% | $331 | 3,262 Recovery |
| 2025 | $450,000 | 28d | 97.1% | $333 | 3,139 |
| 2026* | $480,000 | 24d | 97.8% | $343 | 1,753 ↑ Trending |
* 2026 through July 15 only.
HOW IT WORKS
With over 40 years of combined experience, our team of real estate agents in Philadelphia has the network and expertise to get your property noticed. On average, our listings go under contract within the first two weeks on the market. We handle everything from start to finish—pricing, marketing, negotiations, and paperwork—so you don’t have to worry.
STEP 01
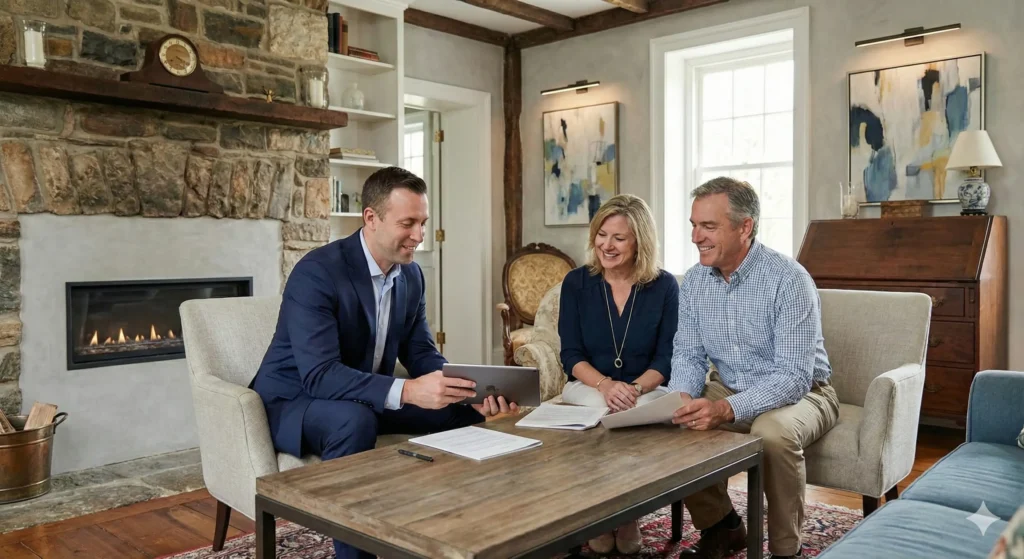
We meet to understand your goals and timeline. We don’t just list; we plan. We’ll discuss the selling process and answer any questions you have. We want to understand your specific needs then build a road-map that align with your goals and your timeline.
STEP 02
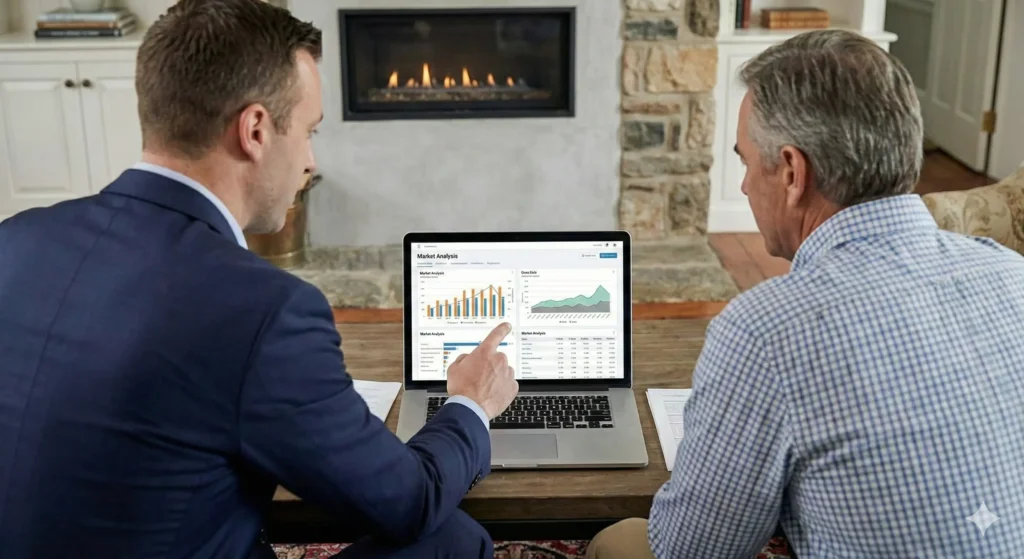
Our team performs a deep dive into local market trends to price your home competitively and maximize your return. We provide expert insight on local trends, buyer & showing activity, ROI-based home improvements, and competitive pricing strategy.
STEP 03
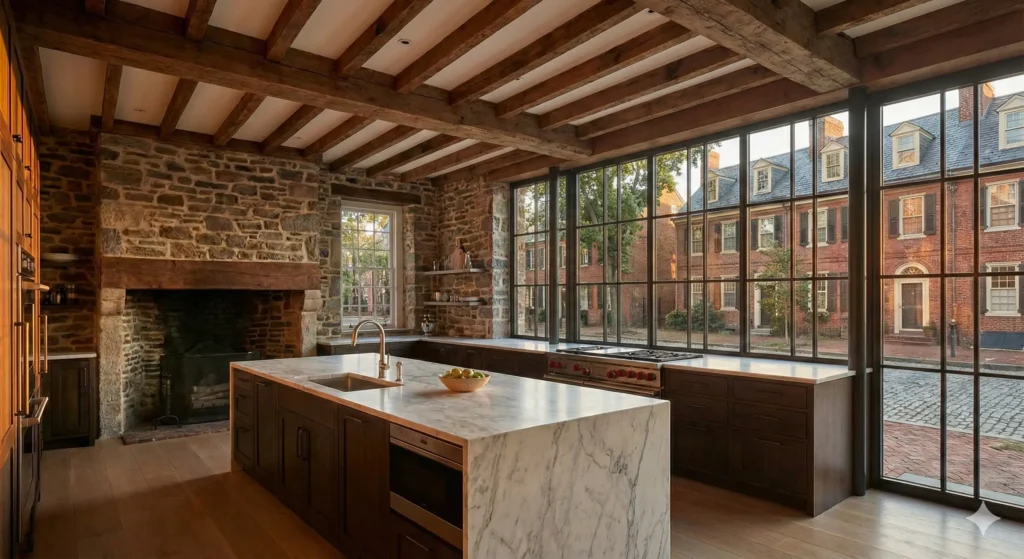
We deploy a custom marketing plan that aligns with your specific goals and your preferred timeline to create maximum exposure. We will discuss professional photos, videos, broker incentives to targeted social media that ensures your First Open House is packed.
COMMON QUESTIONS
Navigating the Philadelphia real estate market can be complex. Philadelphia home values vary block by block. With the guidance of experienced professionals, you can make the most informed decisions and save more money.
Yes, but For Sale By Owner homes in Philly sell for far less than those listed with professional Philadelphia real estate agents. Realtors have fiduciary duty to their clients, protect your asset from risk & liability, handle pricing strategy, marketing, negotiations, and paperwork to get you top value.
Expect agent commission, closing costs, and possible repair or staging expenses. A Philadelphia real estate agent can give you a full breakdown before listing.
Philadelphia’s 10-year tax abatement program has a dramatic effect on buyer demand. Properties with years remaining may command measurably higher prices.
Condo or HOA fee structures, building amenities, and assessment history all affect net buyer purchasing power – and therefore your effective sales price.
On average, homes spend about 85-88 days on the market, but this depends on price, neighborhood, and demand.
Many websites offer free tools like Zillow, Redfin, and Realtor.com, but these can miss hyper-local factors that affect your home prices near you. Our AI-powered, local analysis gives the most accurate home value estimator.
You can start with online tools, but for a truly accurate, no-obligation estimate, speak with a real estate agent in Philadelphia who knows the local market trends.
Yes! Selling quickly depends on pricing, condition, and exposure. For detailed guidance, check out our article How do I sell my home fast in Philadelphia? for expert tips from local real estate brokers, including step-by-step strategies, staging advice, and neighborhood-specific insights.
A local Philadelphia Realtor® will review your home info and provide a free, no-obligation estimate. Know exactly what your home is worth and make informed decisions.
CLIENT SUCCESS STORIES
Real clients. Real results. See why Philadelphia homeowners and buyers trust Venture Philly Group.
"Seamless process from start to finish. In a time where condos were dropping prices, we received 3 competitive offers. Highly recommend!"
"Thanks to Ari, his insights helped me save $60,000 in savings and equity. I used to be a tenant in the very triplex I now own!"
"Jenna went above and beyond. She pointed out issues I wouldn't have noticed. It was clear she genuinely cared about finding the right house, not just making a sale."
"Scott found our house before it even hit Zillow — that head start was huge. Patient with every question, no matter how last-minute the tour request."
"Terrell truly listened to every concern. As a first-time homebuyer I was terrified, but he made me feel comfortable and confident the whole way through."
"As first-time homebuyers we had so many questions. Scott was patient, knowledgeable, and had excellent communication. Truly a wonderful experience!"
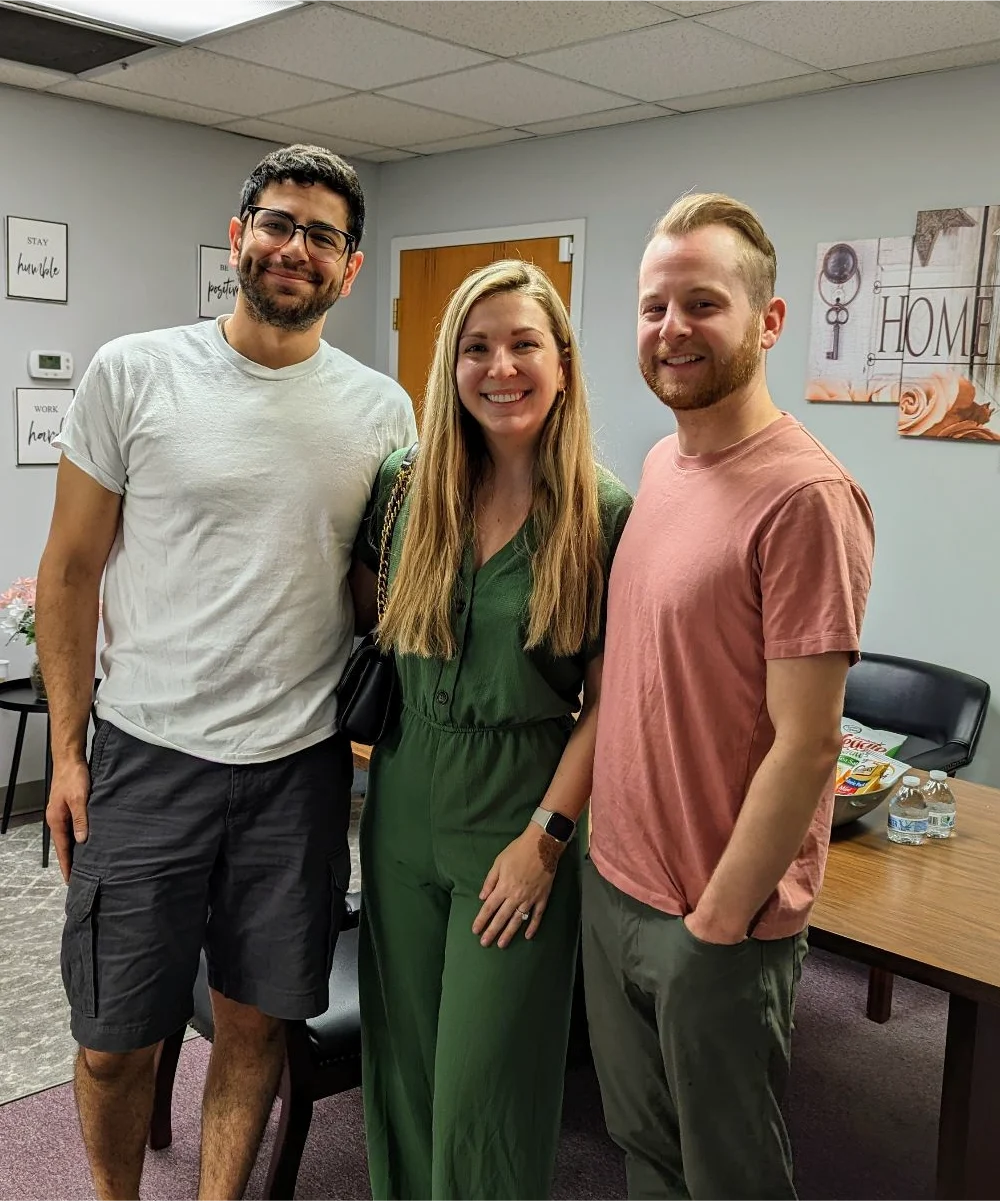
Seamless process from start to finish!! I worked with Scott Sepkowitz to sell my condo and he made it so much easier than expected. He was available to contact at almost any time to answer my questions and was very quick with getting things moving. In a time where condos were dropping their prices, we ended up receiving 3 competitive offers. Highly recommend!!
Homebuyer
Homebuyer
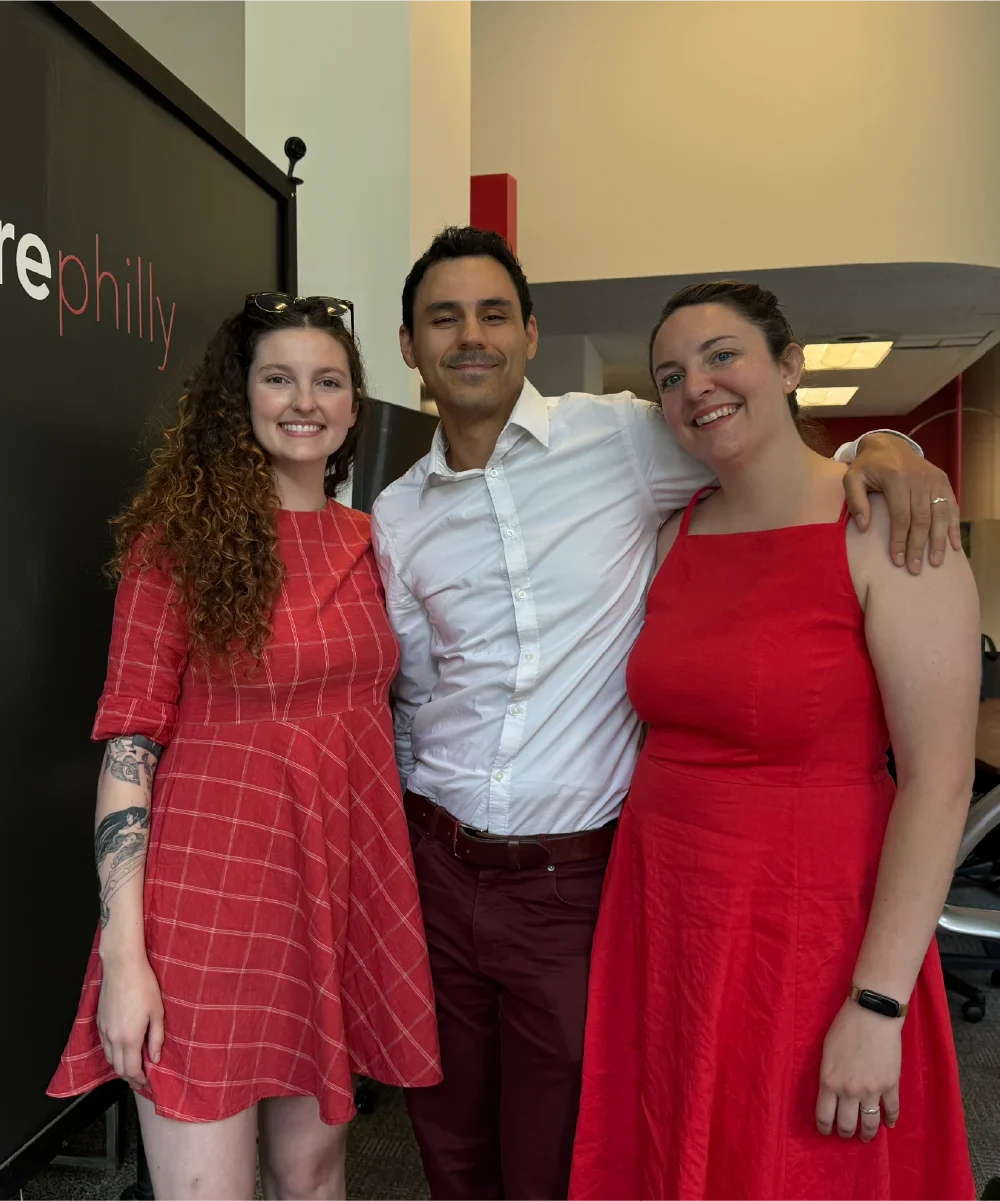
I had an amazing experience working with Jenna Ferreri on the purchase of my home! From start to finish, she went above and beyond to ensure the process was smooth and stress-free. They provided clear, straightforward advice and even pointed out potential issues in homes that I wouldn’t have noticed on my own. It was clear they genuinely cared about helping me find the right house, not just making a sale.
Thanks to their dedication, I found the perfect home, and I couldn’t be happier.
Homebuyer

Homebuyer